A number of improvements have been made to the website, including performance gains backed by new API endpoints.
Map improvements
Better performance
The map now loads faster and pans more smoothly. The original map implementation wasn't very performant and scaled poorly as area coverage grew, so has been replaced with industry-standard vector tiles. See "Under the hood" at the bottom of this post for more details.
Legend
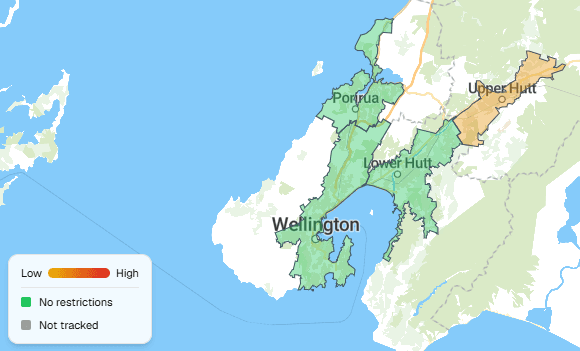
A legend is now available to visually indicate the current water restriction severity of an area.
Clearer area selection
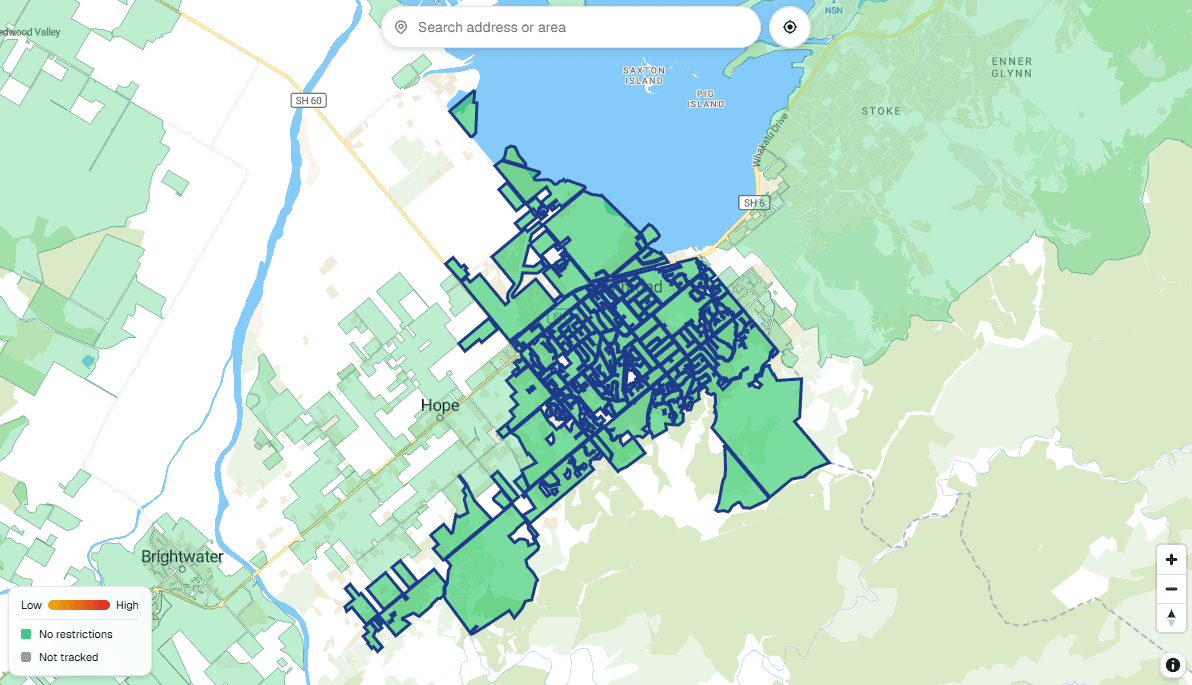
The selected area will now be highlighted with a more distinctive border to differentiate it from other areas.
Area list view controls
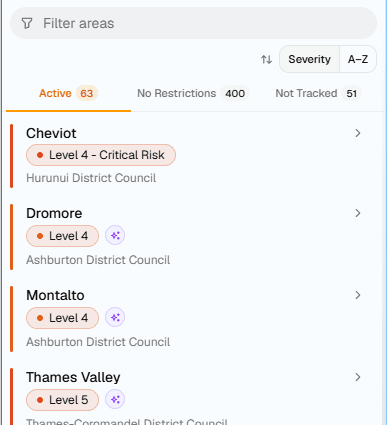
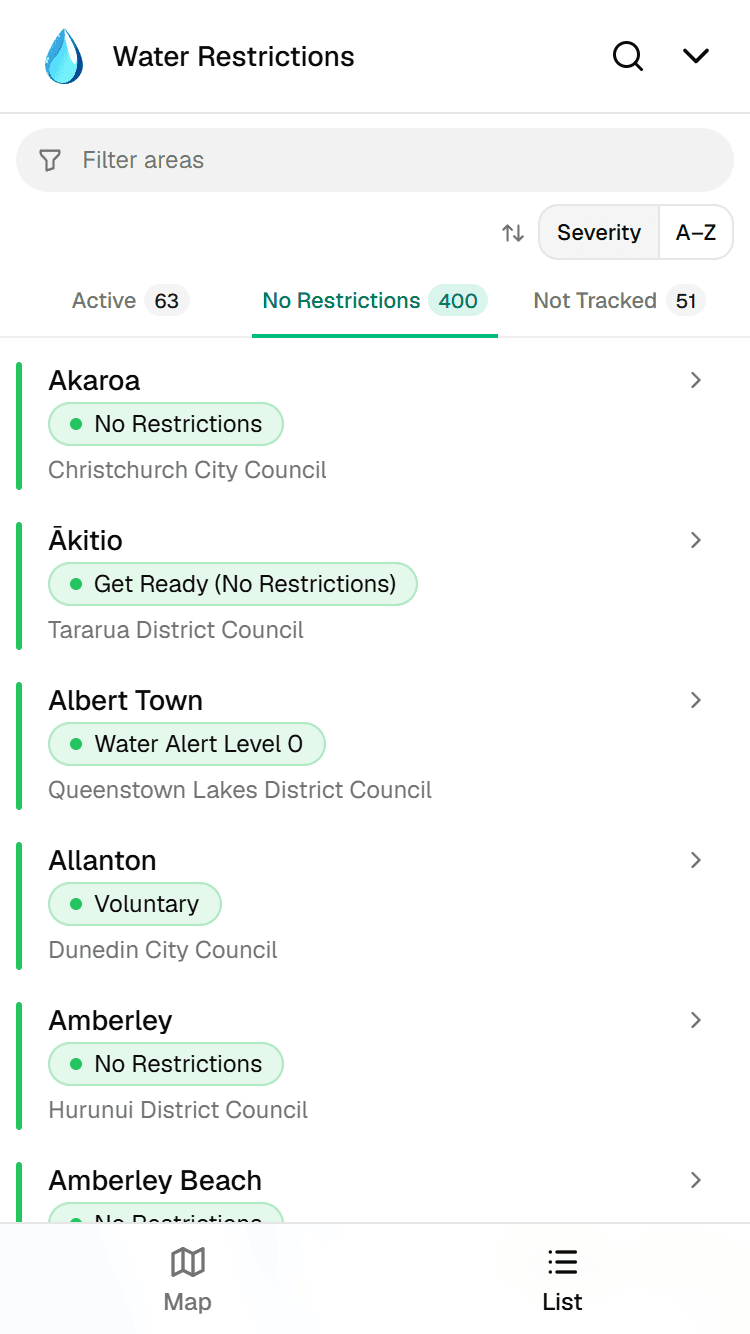
The list view now has better filter and sort controls, with tabs to categorise areas by status – active restrictions, no restrictions, or not tracked.
Mobile experience improvements
Map and list views are now toggled by a persistent bottom tab bar. Previously the list view was built around a sliding drawer with swipe gestures – suited to a native app but not a website.
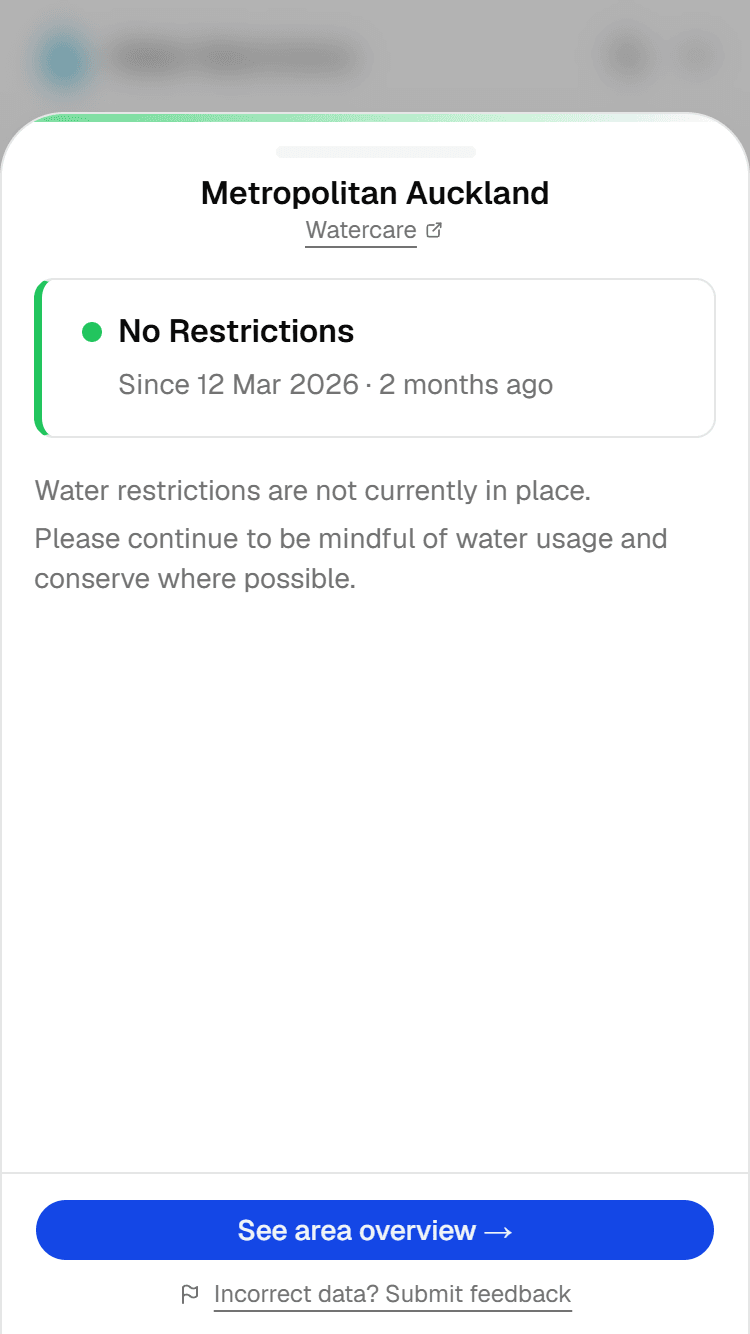
The mobile drawer's sole purpose is now to display a single area's summary with a link to the area overview page.
 |  |
|---|
Better URLs
The website's URLs have been improved for shareability:
- The currently selected area on the map can be linked to directly
- Area overview page URLs now include the area's name rather than just their unique ID
Under the hood
Previously, the API served all area boundaries as a single GeoJSON response – one large payload the browser had to parse and render up front. With 500+ areas, this was becoming a bottleneck on initial load.
It now exposes PostGIS MVT (Mapbox Vector Tile) endpoints. Vector tiles are binary, pre-projected in Mercator, and served per-tile. The browser fetches only the tiles covering the current viewport at the appropriate zoom level. Geometry is pre-computed and cached to improve performance even further.